Fayil:Vostok Petit data.svg

Hoton asali (Fayil kin SVG, saƙar fikisal 1,024 x 768, girman fayil: 81 KB)
Taƙaici
| Bayani |
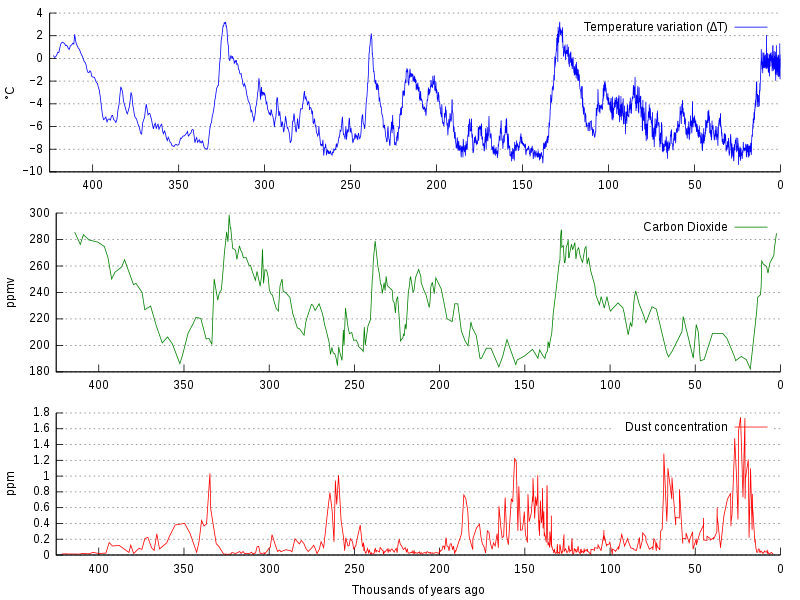
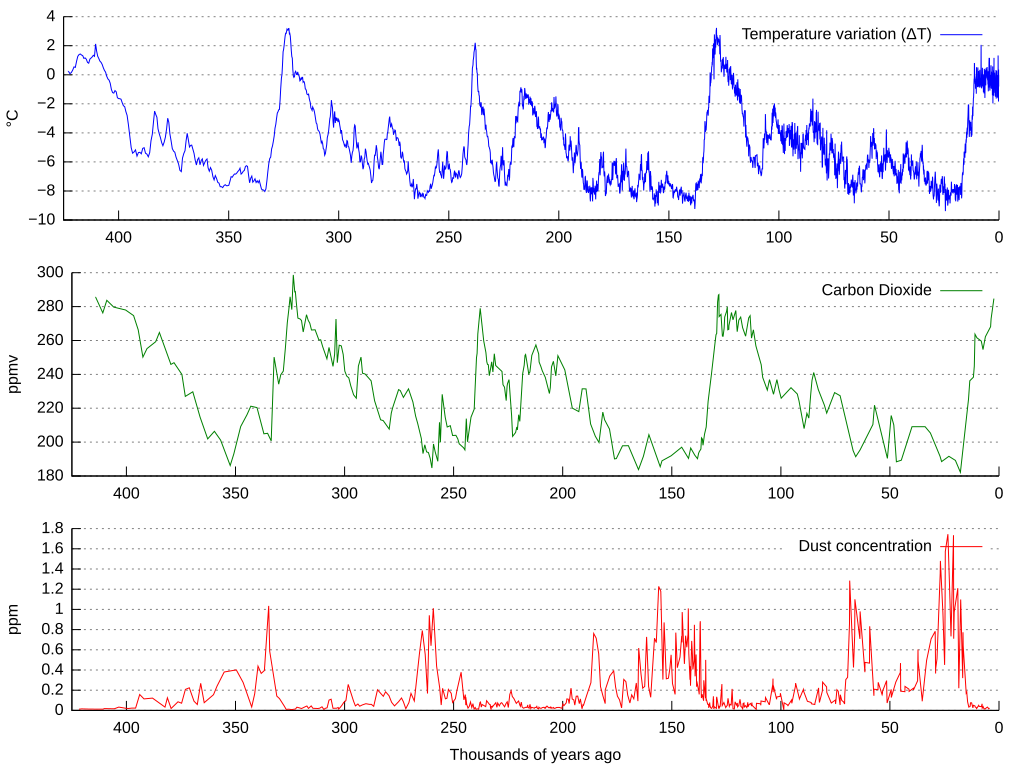
La bildo estas kopiita de wikipedia:en. La originala priskribo estas: Graph of CO2 (Green graph), temperature (Blue graph), and dust concentration (Red graph) measured from the Vostok, Antarctica ice core as reported by Petit et al., 1999. Higher dust levels are believed to be caused by cold, dry periods. The Earth's orbital eccentricity, tilt, and precession vary in a pattern over thousands of years. The IPCC notes that Milankovitch cycles drove the ice age cycles; CO2 followed temperature change "with a lag of some hundreds of years" (visible on a graph more zoomed in than this); and that as a feedback amplified temperature change. Among other factors, CO2 is more soluble in colder than in warmer waters. العربية: مخطّطٌ يُبيّن علاقة ثاني أوكسيد الكاربون ودرجة الحرارة وتركيز الغبار في قالب جليد فوستوك (بالإنجليزيّة: Vostok ice core) خلال 450,000 سنة الماضيّة |
| Rana | |
| Masomi | Own work based on: Vostok-ice-core-petit.png by NOAA |
| Marubucin |
Original: Unknown Vector: |
| Other versions |
Derivative works of this file: |
| SVG genesis | This plot was created with Gnuplot. This file is translated using SVG switch elements: all translations are stored in the same file. |
Data sets used are:
- ftp://ftp.ncdc.noaa.gov/pub/data/paleo/icecore/antarctica/vostok/deutnat.txt
- ftp://ftp.ncdc.noaa.gov/pub/data/paleo/icecore/antarctica/vostok/co2nat.txt
- ftp://ftp.ncdc.noaa.gov/pub/data/paleo/icecore/antarctica/vostok/dustnat.txt
Source code
Gnuplot code
unset multiplot
set term svg size 1024,768
set output "vostok-data.svg"

set border 3
set xtics nomirror
set ytics nomirror
unset xlabel
unset ylabel

set grid y
set multiplot layout 3,1

set ylabel "°C"
plot [-425:0] [-10:4] \
        "deutnat.txt" \
        using (-$2/1000):4 \
        title "Temperature variation (ΔT)" \
        ls 3 \
        with lines

set ylabel "ppmv"
plot [-425:0] \
        "co2nat.txt" \
        using (-$1/1000):2 \
        title "Carbon Dioxide" \
        ls 2 \
        with lines

set xlabel "Thousands of years ago"
set ylabel "ppm"
plot [-425:0] \
        "dustnat.txt" \
        using (-$1/1000):2 \
        title "Dust concentration" \
        ls 1 \
        with lines
Explanation
After executing gnuplot, the resulting SVG file was manually changed to
* remove the negative signs for the x axis values
* change the [[:w:hyphen-minus|hyphen-minus]] characters in the temperature axis values to proper minus sign characters
| Wannan fayil ɗin an bada lasisin shi ƙarƙashin Creative Commons Attribution-Share Alike 3.0 Unported lasisi. | ||
| ||
| This licensing tag was added to this file as part of the GFDL licensing update. |

|
An bada damar a kofa, a yaɗa/ko sauya wannan kundi ƙarƙashin Lasisin GNU ta kyauta, Fitarwa na 1.2 ko duk wani fitarwa da zai biyo baya daga Gidauniyar Samar da Software ta Kyauta; ba tare da sauyin sashe ba, babu Rubutun Fuskar gaban shafi, kuma babu Rubutun bayan shafi. Kofi na lasisin na nan an sanya sa aciki ƙarƙashin sashen GNU Free Documentation License. |
Original upload log
This image is a derivative work of the following images:
- Vostok-ice-core-petit.png licensed with Cc-by-sa-3.0-migrated, GFDL
- 2006-02-15T20:38:10Z Maksim 598x441 (31557 Bytes) La bildo estas kopiita de wikipedia:en. La originala priskribo estas: Graph of [[carbon dioxide|CO2]], [[temperature]], and dust concentration measured from the [[Vostok, Antarctica]] [[ice core]] as reported by Petit et al.
Uploaded with derivativeFX
Tarihin fayil
Ku latsa rana/lokaci ku ga fayil yadda yake a wannan lokaci
| Rana/Lokaci | Wadar sufa | Kusurwowi | Ma'aikaci | Bahasi | |
|---|---|---|---|---|---|
| na yanzu | 13:01, 25 ga Yuni, 2021 | | 1,024 × 768 (81 KB) | Matěj Orlický | File uploaded using svgtranslate tool (https://svgtranslate.toolforge.org/). Added translation for cs. |
| 22:25, 30 Nuwamba, 2013 |  | 1,024 × 768 (77 KB) | SeL media | time axis reversed | |
| 17:39, 25 Satumba 2011 |  | 1,024 × 768 (309 KB) | Hel-hama | text improved | |
| 03:07, 27 ga Afirilu, 2011 |  | 1,024 × 768 (83 KB) | Awickert | Didn't realize that it was a draw-on box instead of a measuring-box. Take 3! | |
| 03:05, 27 ga Afirilu, 2011 |  | 1,024 × 768 (83 KB) | Awickert | [Shoot - last time, picked original instead of new version to upload] Manually moved axes in Inkscape such that the three plots line up with one another | |
| 03:02, 27 ga Afirilu, 2011 |  | 1,024 × 768 (75 KB) | Awickert | Manually moved axes in Inkscape such that the three plots line up with one another | |
| 13:25, 20 ga Yuni, 2010 |  | 1,024 × 768 (75 KB) | Autopilot | {{Information |Description=La bildo estas kopiita de wikipedia:en. La originala priskribo estas: Graph of CO<sub>2</sub> (Green graph), temperature (Blue graph), and dust concentration (Red graph) measured from the [[Vostok, Antarc |
Amfani da fayil
Wadannan 2 shafuka suna amfani wannan fayil:
Amfanin fayil a ko'ina
Wadannan sauran wikis suna amfani da fayil din anan
- Amfani a kan af.wikipedia.org
- Amfani a kan ar.wikipedia.org
- Amfani a kan be.wikipedia.org
- Amfani a kan bg.wikipedia.org
- Amfani a kan ca.wikipedia.org
- Amfani a kan cs.wikipedia.org
- Amfani a kan cy.wikipedia.org
- Amfani a kan da.wikipedia.org
- Amfani a kan de.wikipedia.org
- Amfani a kan en.wikipedia.org
- Climate variability and change
- Global cooling
- Ice core
- Orbital forcing
- Quaternary glaciation
- Carbon dioxide in Earth's atmosphere
- Talk:Ice age/Archive 1
- File talk:Vostok Petit data.svg
- List of periods and events in climate history
- User talk:Jc-S0CO/Archives/2013/2
- User:Mark Buchanan/sandbox/QuatGlac
- User:Mark Buchanan/sandbox/Glaciation-WIP
- Portal:Climate change
- Talk:Climate variability and change/Archive 8
- Amfani a kan en.wikiversity.org
- Amfani a kan es.wikipedia.org
- Amfani a kan eu.wikipedia.org
- Amfani a kan fa.wikipedia.org
- Amfani a kan fi.wikipedia.org
- Amfani a kan fi.wikiversity.org
- Amfani a kan fr.wikipedia.org
- Amfani a kan gl.wikipedia.org
- Amfani a kan he.wikipedia.org
- Amfani a kan it.wikipedia.org
- Amfani a kan ja.wikipedia.org
- Amfani a kan jv.wikipedia.org
- Amfani a kan ka.wikipedia.org
Duba ƙarin amfanin wannan fayil.